

Analytics & Insights
Three pages: Analytics shows the state of your catalog, Insights gives you commercial intelligence to act on, and Store Performance (in the menu: Store) shows revenue from your actual WooCommerce orders.
Three pages: Analytics shows the state of your catalog, Insights gives you commercial intelligence to act on, and Store Performance (in the menu: Store) shows revenue from your actual WooCommerce orders.
Analytics and the revenue overview on Store Performance are available on every plan. Insights, and the Profit & Margin section of Store Performance, need the Pro or Business plan. See Plans & Pricing.
Analytics
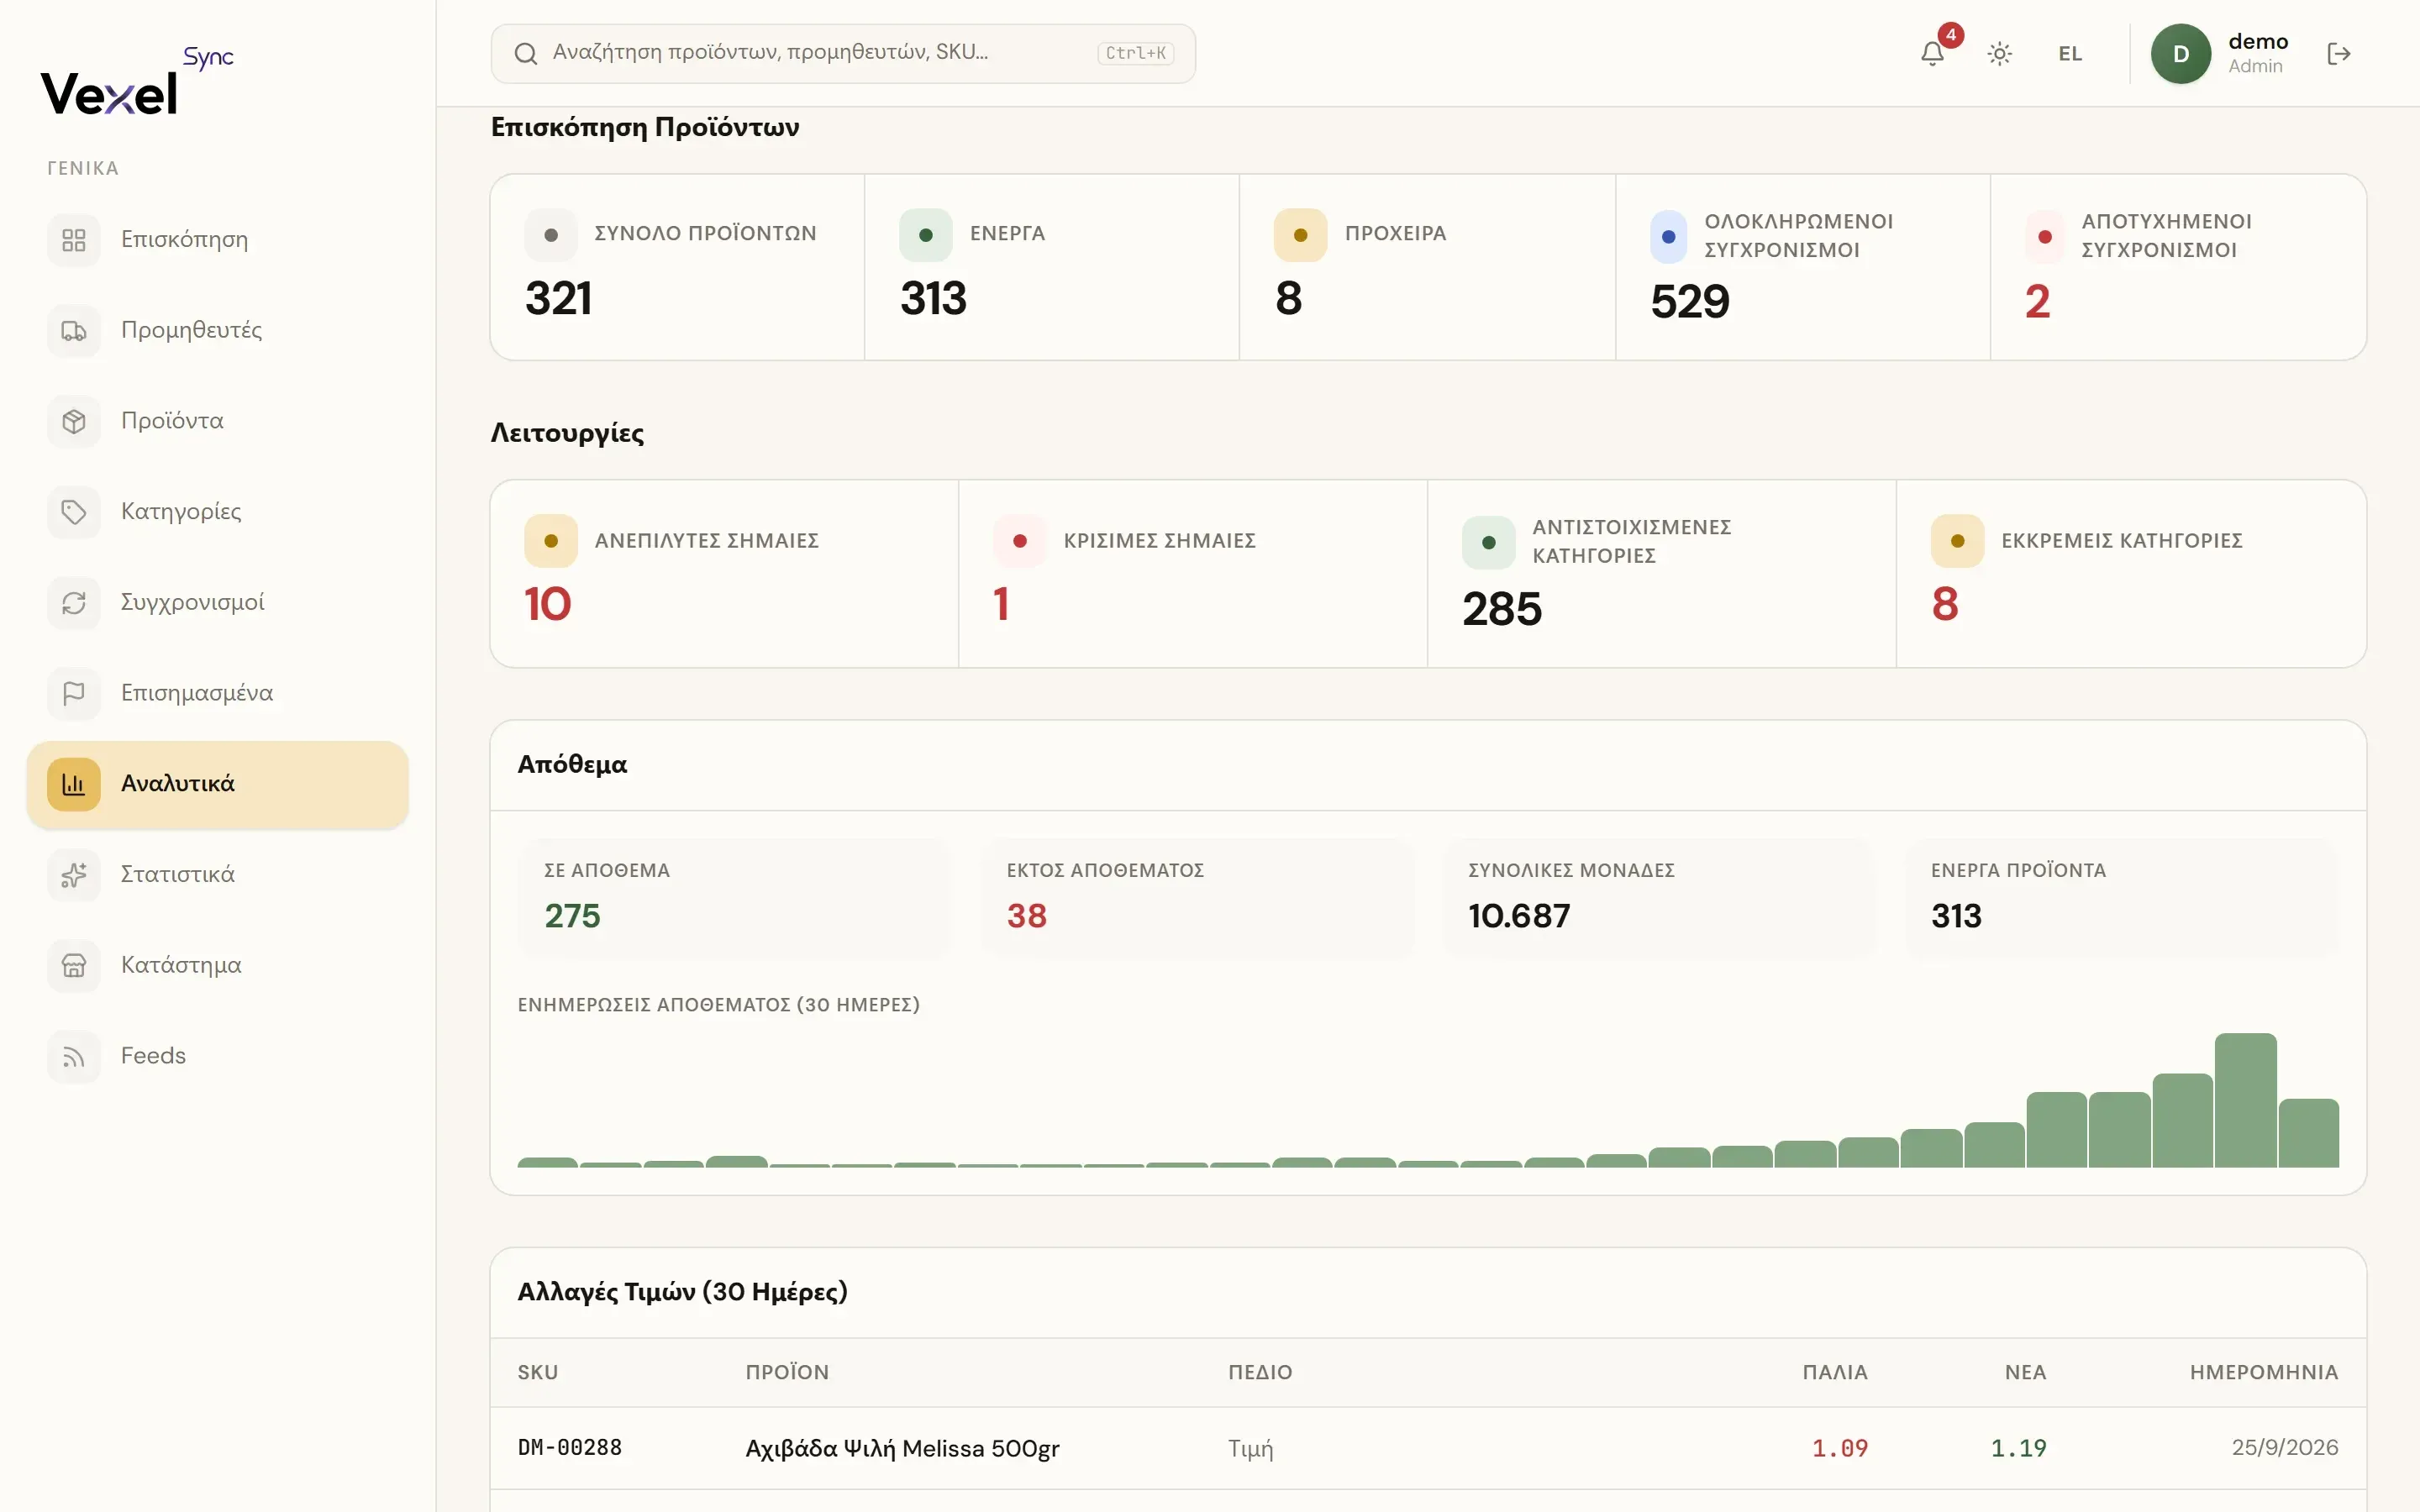
- Product Overview: total, active, draft.
- Operations: completed/failed syncs, unresolved and critical flags, mapped/pending categories.
- Inventory: in stock, out of stock, total units, plus a 30-day stock-updates chart.
- Price Changes (30 Days): which SKU changed, old → new price, when.
Insights
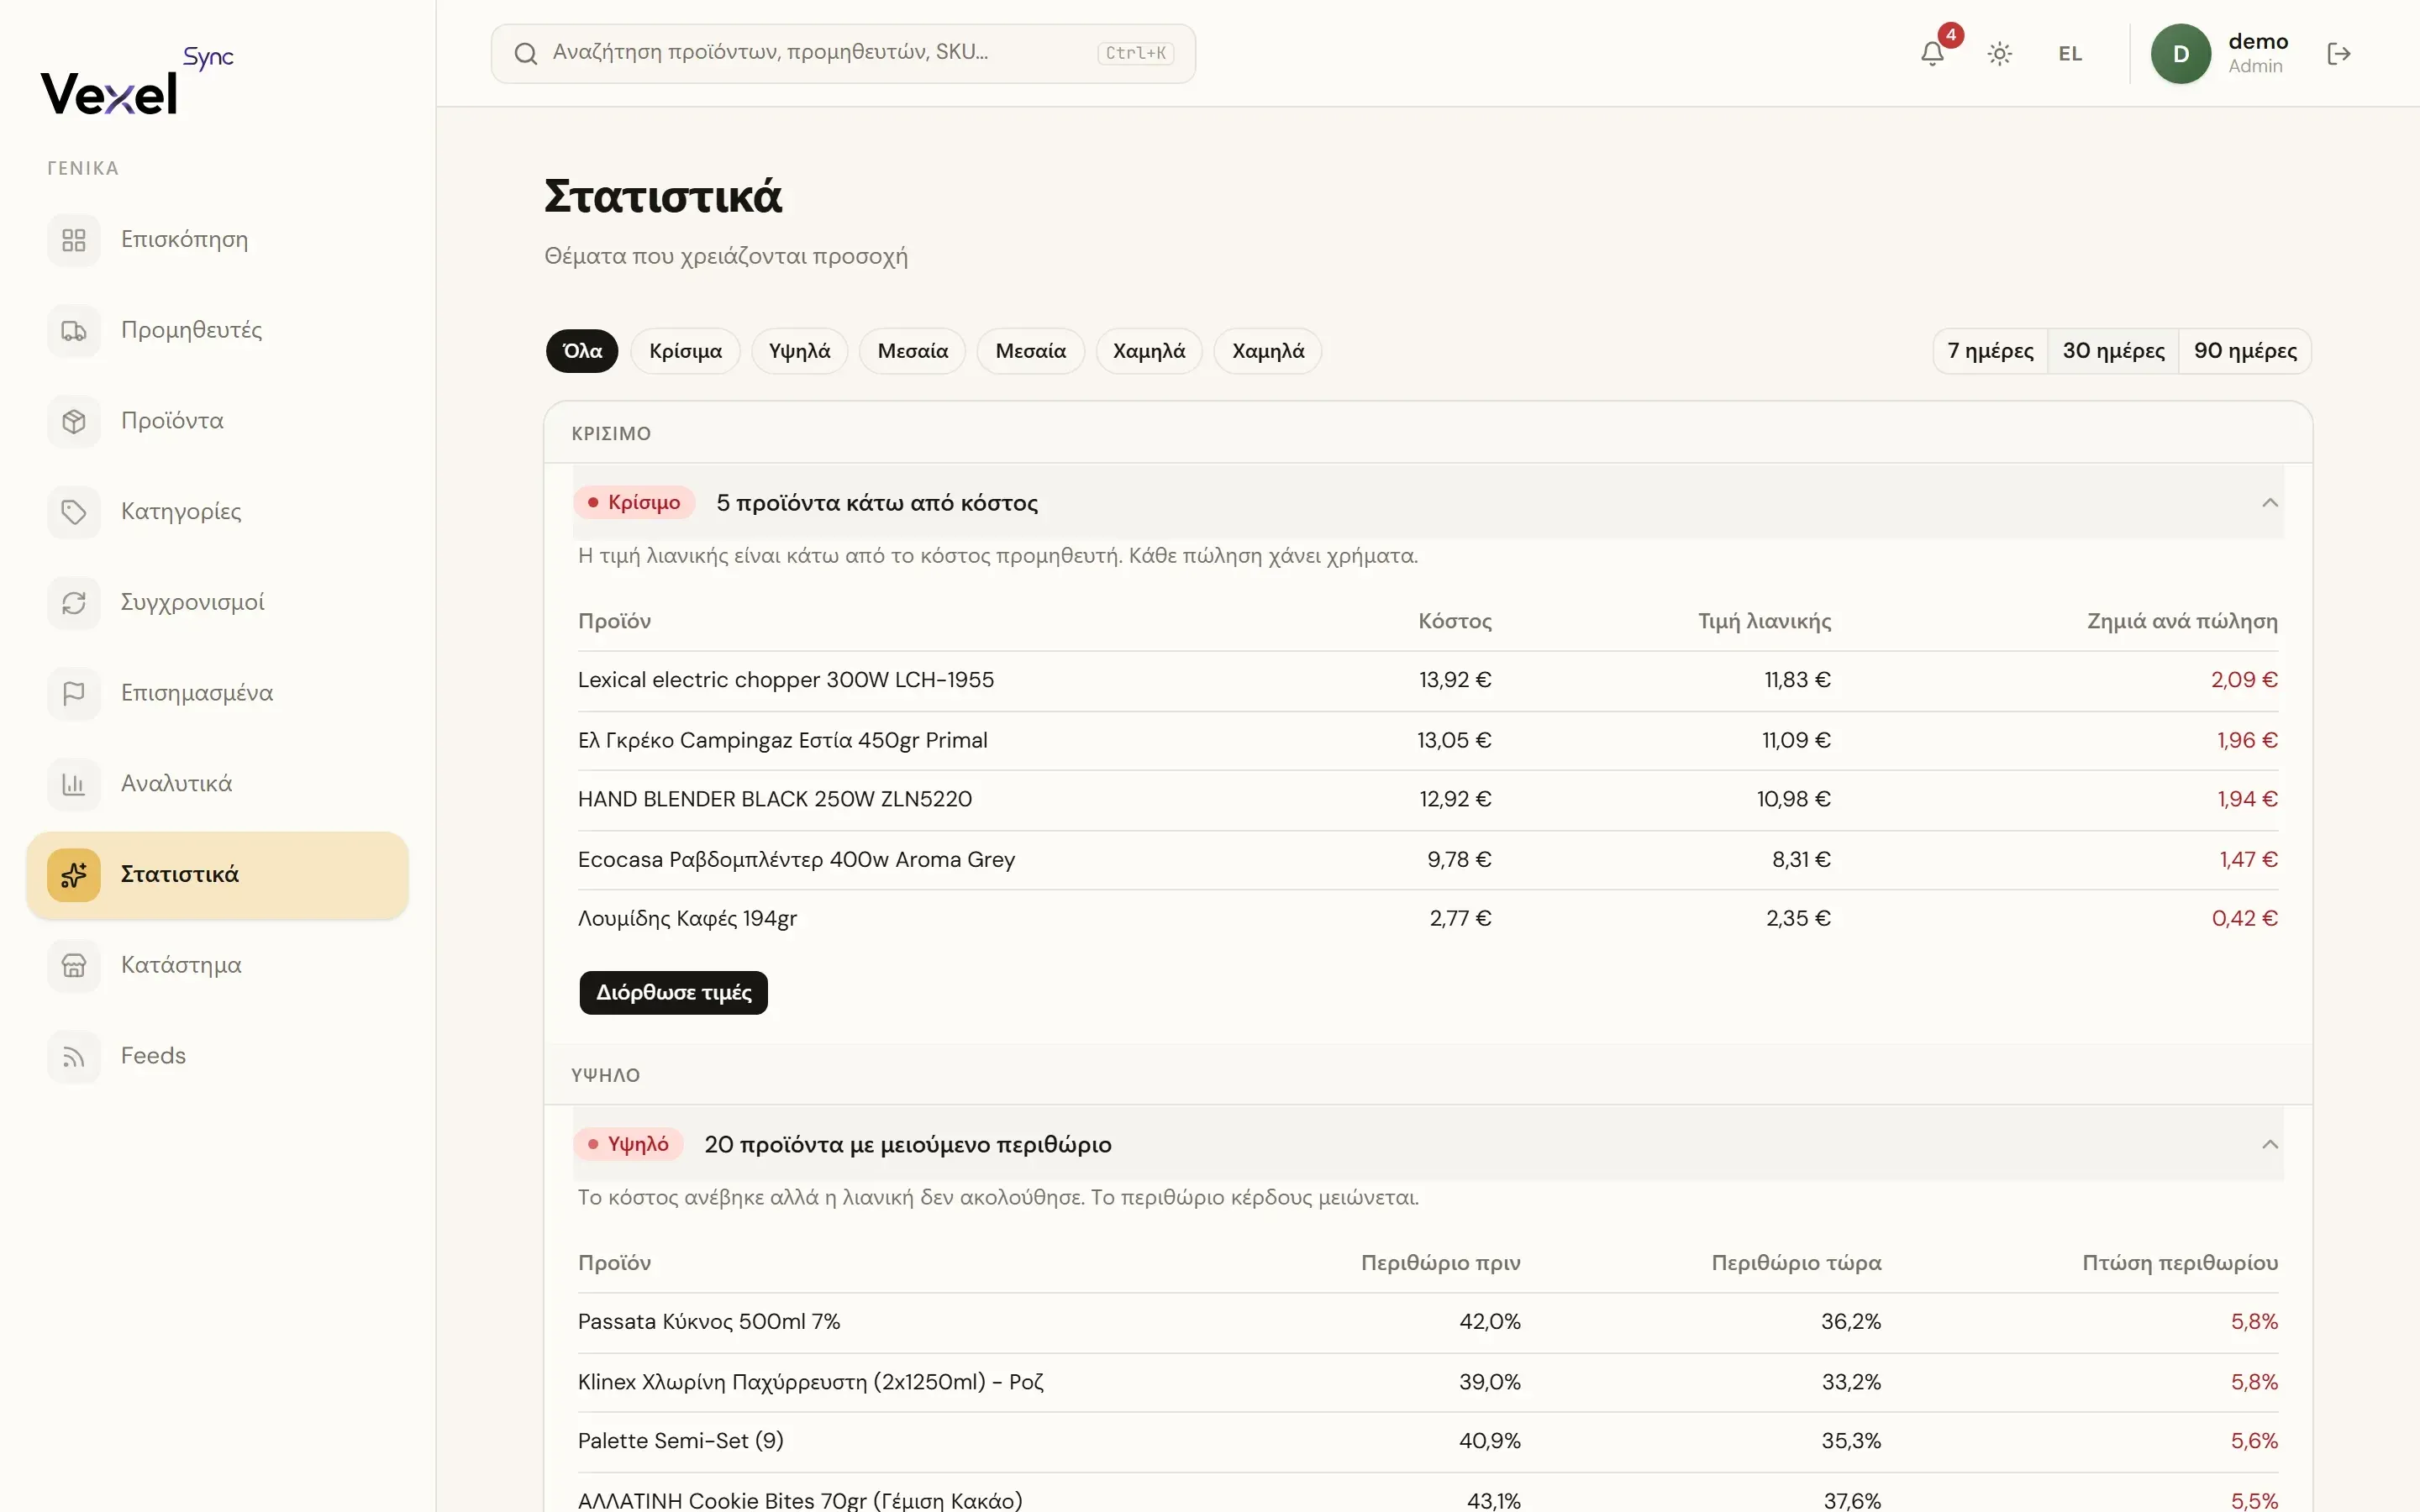
Pick a Window (7 days up to 12 months). Data starts appearing 24 hours after your first sync.
KPIs
Average cost drift, Changed SKUs, Went out of stock, Restocked, Currently out of stock, Active SKUs: all compared to the previous period.
Needs-attention cards
Prioritized cards (Critical → Stable) that automatically detect:
| Card | What it detects |
|---|---|
| Hot opportunity | Products moving fast at a supplier that you don't sell yet |
| Products below cost | Retail price is below supplier cost; every sale loses money |
| Margin compression | Cost went up but retail didn't follow |
| Chronic stockouts | Products that repeatedly run out of stock |
| Discontinuation risk | Products missing from the feed for 7+ days |
| New additions | Recent supplier additions you haven't reviewed |
| Cheaper supplier options | The same SKU is available cheaper from another supplier |
| Cost drift | A broad cost increase/decrease from a supplier |
| Stable supplier | No cost changes, no chronic stockouts, a reassurance card, no action needed |
Each card has Show details with the affected products and a suggested action.
Tables
- Per supplier: cost drift, 30-day trend, changes, stockouts.
- Top movers: the SKUs with the biggest price changes (cost or retail, drops or rises).
- Stock events: stockouts and restocks over the last 30 days.
Store Performance
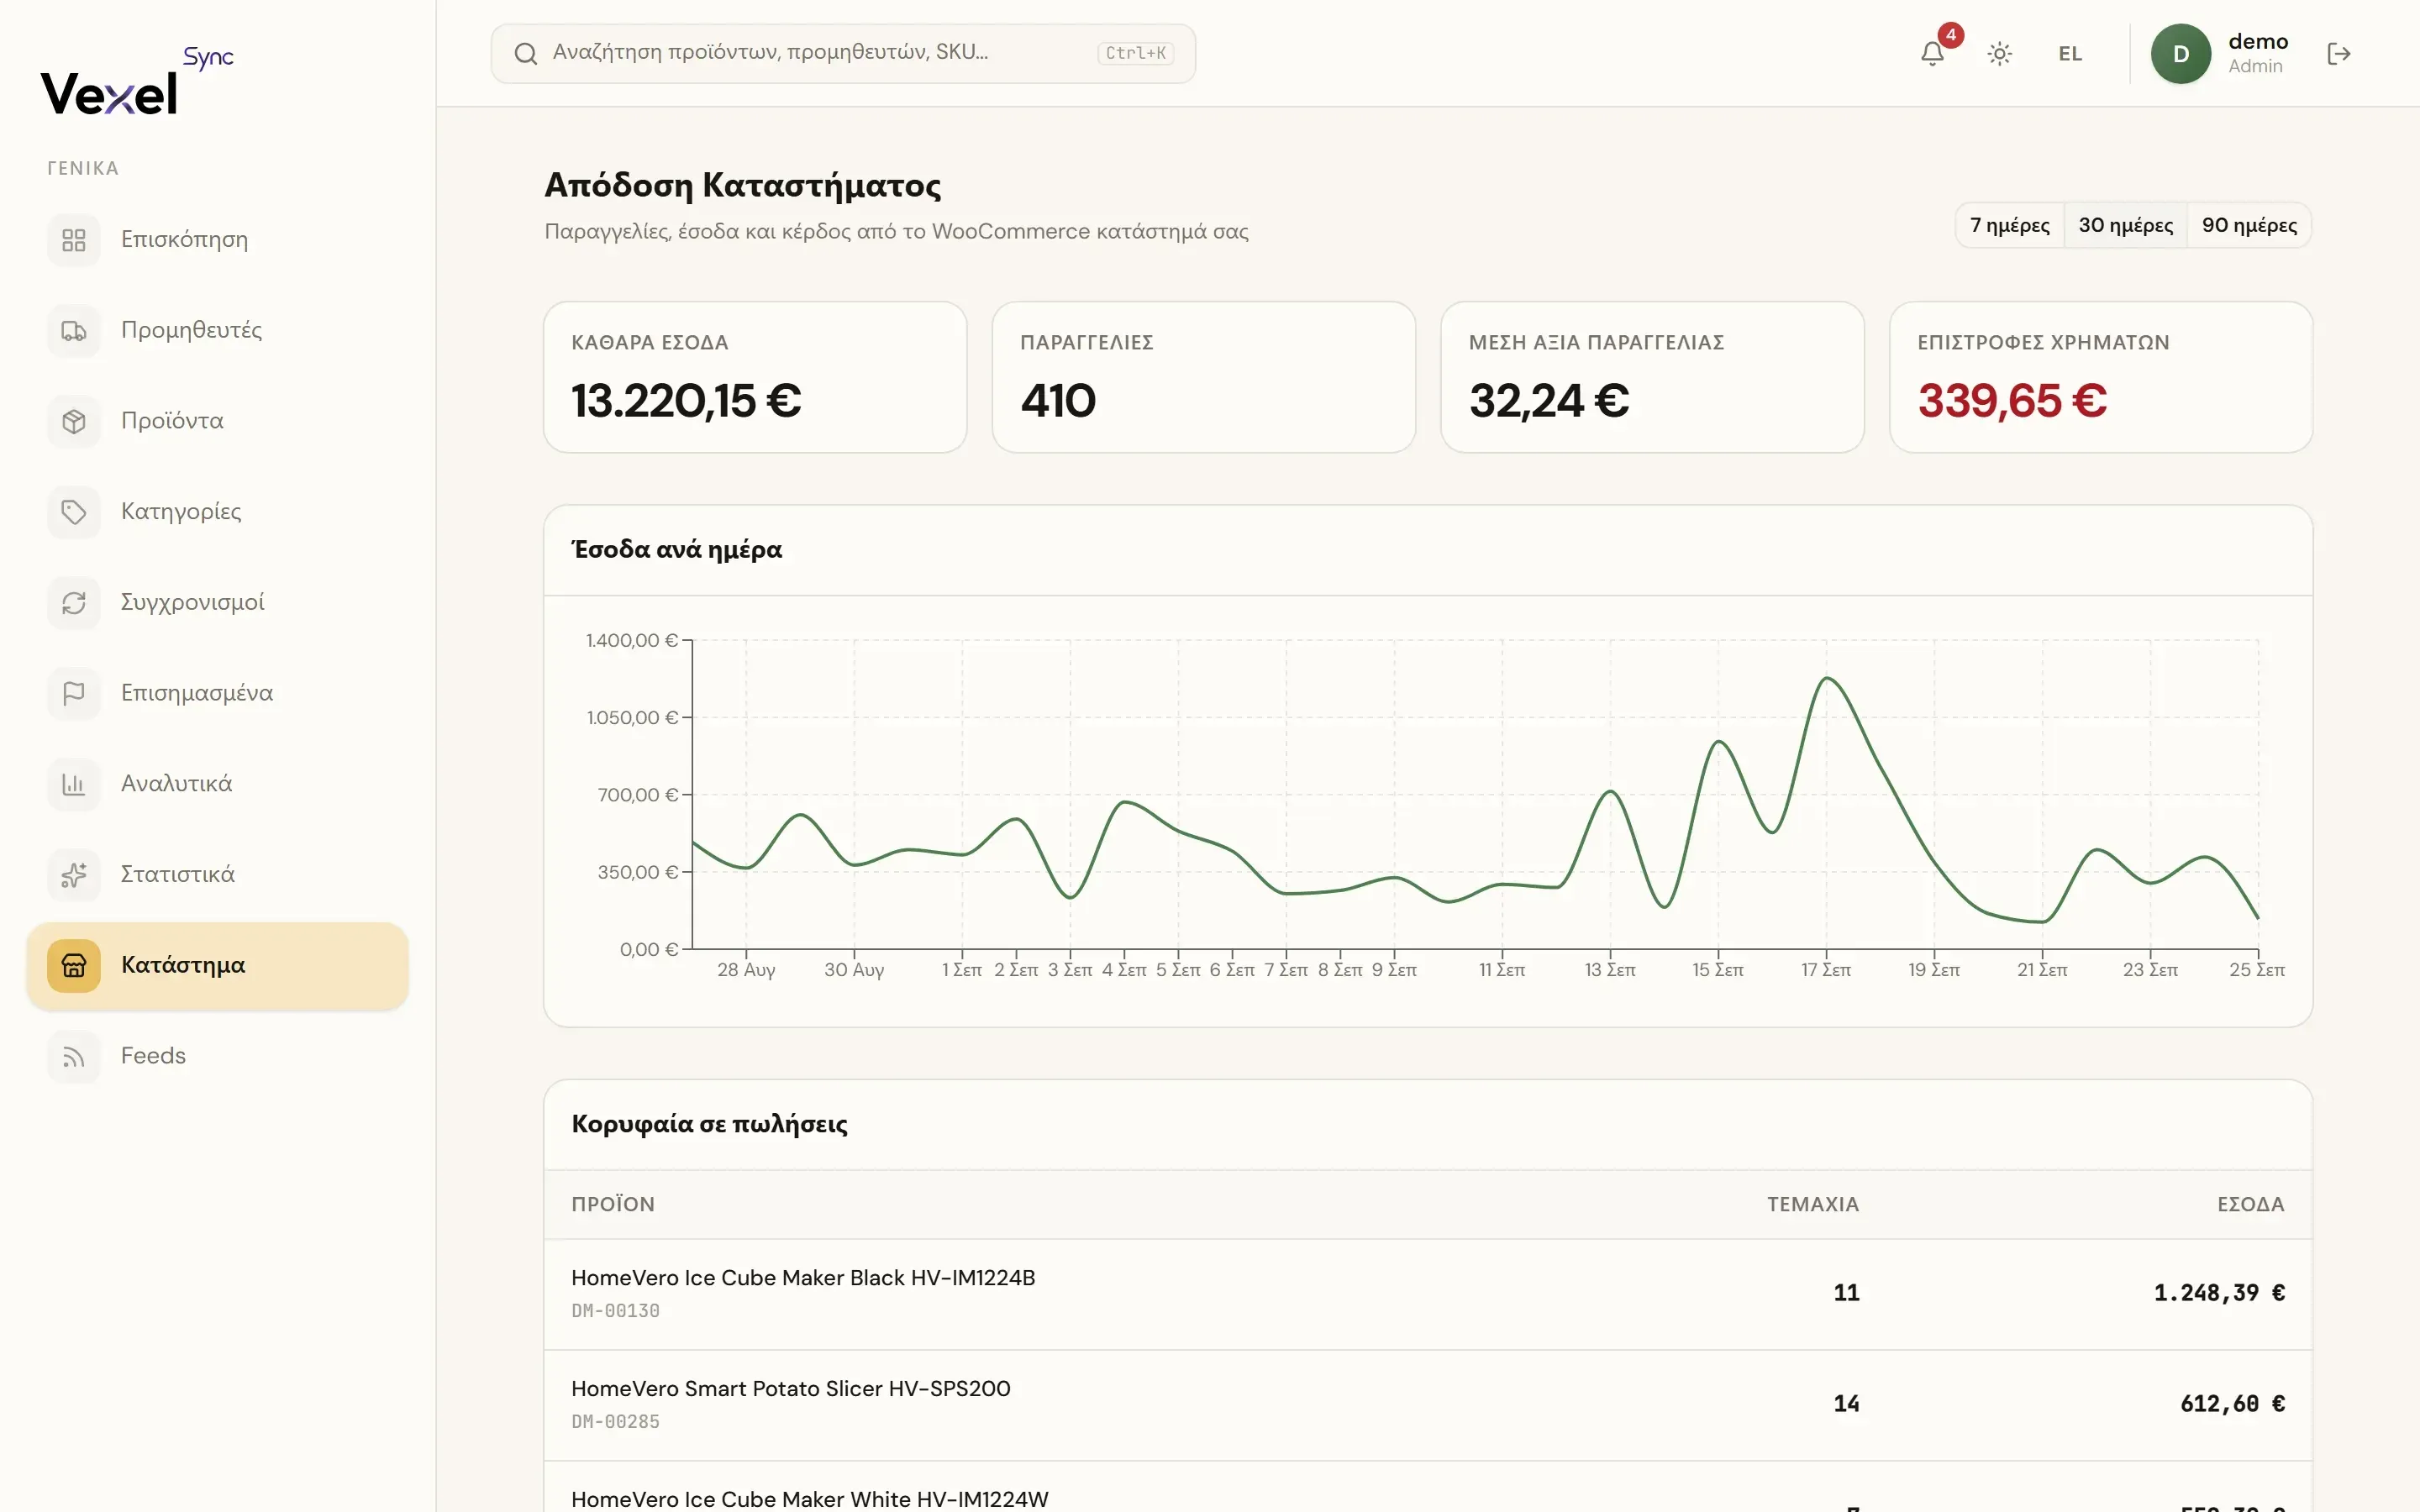
Real revenue and profit from your WooCommerce orders (pulled in automatically once your store is connected).
- KPIs: net revenue, orders, average order value, refunds, over a 7/30/90-day window.
- Revenue by day and a Top Sellers table for the same window.
- A connection/backfill status notice while historical orders are still being imported.
Profit & Margin (Pro and Business)
Profit and margin %, computed by matching order line items to your cost prices at the time of sale, broken down per supplier and per product. On Starter this section is shown blurred with an upgrade prompt; the KPIs and revenue chart above stay available.